Data Analyst
A Data Analyst Program is designed to equip learners with the skills needed to collect, clean, analyze, and visualize data for making data-driven decisions. This program is suitable for students, working professionals, and beginners looking to enter the field of data analytics.
📌 Data Analyst Program Structure
1. Introduction to Data Analytics (Week 1-2)
✅ Understanding Data Analytics & Its Applications
✅ Role of a Data Analyst
✅ Basics of Data Collection & Data Types
✅ Introduction to Spreadsheets (Excel/Google Sheets)
2. Data Handling & Preprocessing (Week 3-4)
✅ Data Cleaning & Formatting Techniques
✅ Handling Missing Data & Duplicates
✅ Introduction to SQL – Querying Databases
✅ Working with CSV, JSON, and API Data
3. Exploratory Data Analysis (EDA) (Week 5-6)
✅ Descriptive Statistics (Mean, Median, Mode, Standard Deviation)
✅ Data Visualization with Matplotlib & Seaborn (Python) or Power BI & Tableau
✅ Identifying Trends & Patterns in Data
✅ Using Pivot Tables & Charts in Excel
4. Advanced Analytics & Business Intelligence (Week 7-8)
✅ SQL Joins, Subqueries & Aggregation Functions
✅ Advanced Excel – Macros & Data Analysis ToolPak
✅ Introduction to Business Intelligence (BI) Tools
✅ Introduction to Python for Data Analysis (Pandas & NumPy)
5. Machine Learning Basics for Data Analysts (Week 9-10)
✅ Introduction to Predictive Analytics
✅ Basics of Machine Learning (Supervised vs Unsupervised Learning)
✅ Implementing Simple Models with Scikit-Learn
✅ Data-Driven Decision Making
6. Real-World Projects & Case Studies (Week 11-12)
✅ Hands-on Project: Analyzing Business Data
✅ Case Study on Market Trends & Customer Insights
✅ Resume Building & Portfolio Creation
✅ Mock Interviews & Job Readiness Training
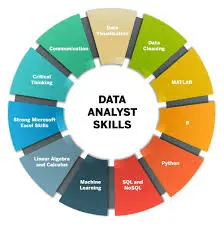
📊 Tools & Technologies Covered
📌 Excel & Google Sheets – Data Handling & Analysis
📌 SQL – Querying Databases (MySQL, PostgreSQL)
📌 Python – Pandas, NumPy, Matplotlib, Seaborn
📌 Power BI & Tableau – Data Visualization
📌 Jupyter Notebook & Google Colab – For Python-based Analytics
📝 Learning Methods & Assessments
✅ Hands-on Projects & Assignments
✅ Live Case Studies & Industry Examples
✅ Group Discussions & Peer Reviews
✅ Online Tests & Certification
📅 Program Duration & Mode
🎓 Duration: 3 Months (Flexible based on learner needs)
💻 Mode: Online
This content will be shared across all product pages.
